To people already familiar with the argument, this may be old news. It’s an analogy to help people feel the intuitive force of the argument.
Suppose the following: New diseases appear inside people all the time. Only one in ten diseases is contagious, but the contagious diseases spread to a thousand other people, on average, before dying out. The non-contagious ones don’t spread to anyone else. You get sick. You haven’t yet gone to the doctor or googled your symptoms; given the above facts, part of you wonders whether you should bother… after all, 90% of diseases only ever infect one person. So, how likely is it that someone else has had your disease before?
Draw a Venn diagram with two circles: “First victim” and “contagious.” This makes three interesting categories:
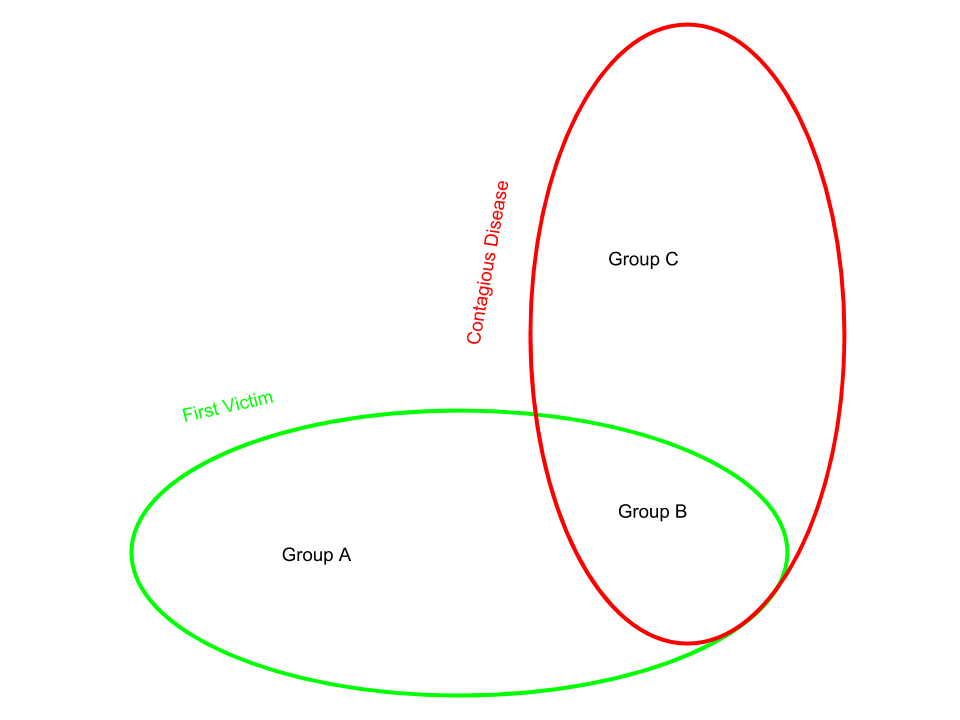
A = First victims of noncontagious diseases
B = First victims of contagious diseases
C = Nonfirst victims of contagious diseases
Since only one in ten diseases is contagious, B/A = 1/9.Since contagious diseases spread to a thousand people on average, B/C is 1/1000. It follows that C/(A+B+C) = 100/101.
Since you know you are diseased, you should assign credence to each hypothesis “I’m in A” “I’m in B” “I’m in C” equal to the fraction of diseased people who are in that category, at least until you get evidence that you would be more likely to get in one category than another.
(For example, if you google your symptoms and get zero hits, that’s evidence that is more likely to happen to people in group A or B, so you should update to be less confident that you are in group C than the base rate would suggest.)
So you are almost certain to be in category C, since they make up 100/101 of the total population of diseased people, and at the moment you don’t have any evidence that is less likely to happen to people in category C than people in the other categories. So it’s almost certain that other people have had your disease already, even though 90% of diseases only ever infect one person.
In the simulation argument, the reasoning is similar.
Suppose that 90% of non-simulated civilizations never create ancestor sims, but that the remaining 10% create 1000 each on average. Then most civilizations are ancestor-simulated.
Do we have any evidence that is more likely to happen to people who are ancestor-simulated than people who are not, or vice versa?
You might think the answer is yes: For example, simulated people are more likely to see things that appear to break the laws of physics, more likely to see pop-up windows saying “you are in a simulation,” etc.
But Bostrom anticipates this when he restricts his argument to ancestor simulations. Ancestor simulations are designed to perfectly mimic real history, so the answer is no: Someone in category C is just as likely to see what we see as someone in category B or A.
So even if we rule out non-ancestor-simulations entirely, the argument goes through: Most civilizations with evidence like ours are ancestor-simulated, and we don’t have any reason to think we are special, so we are probably ancestor-simulated. And of course, we shouldn’t rule out non-ancestor-simulations entirely, so the probability that we are simulated should be even higher than the probability we are ancestor-simulated.
(Clarificatory caveat: Bostrom’s argument is NOT for the conclusion that we are in a simulation; rather, it is a triple-disjunct. In the framing discussed here, Bostrom leaves open the possibility that Group A is extremely large relative to Group B, large enough that it is bigger than B and C combined.)
